

In the face of downturns, many new stakeholders...
Financial market indicators
In recent weeks, the financial markets have been talking more and more intensely about a possible change of trend in the equity market. As we can see below, there is no doubt that the market is still in a BULL market. However, at the same time we can note that there is an exhaustion in the trend and that the market has been finding it increasingly difficult to reach new highs.
Market performance
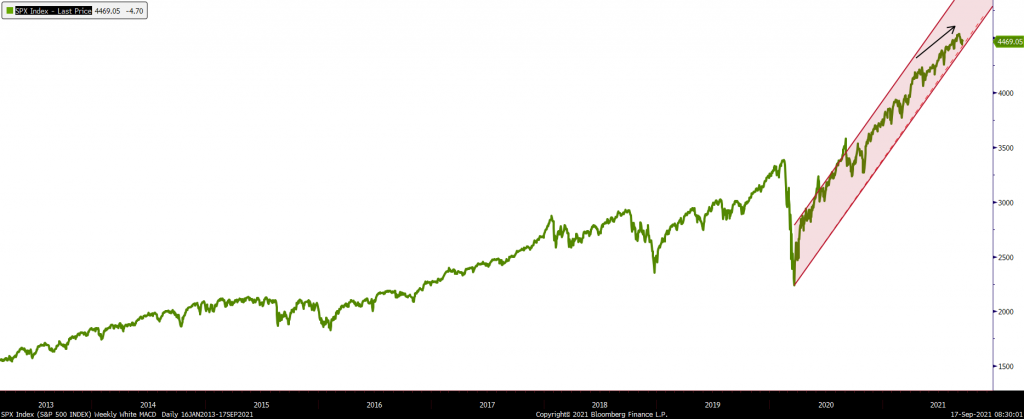
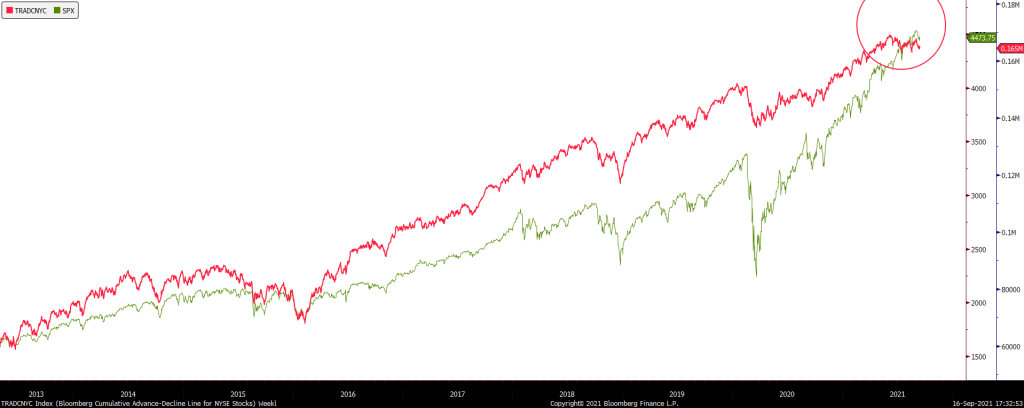
Interestingly, in the last 38 sessions the market has not been able to achieve a daily return greater than 1%; making it the longest streak in a span of approximately two years. On the other hand, there are certain financial indicators that could be giving some signals to watch out for. Below, we can see how the technical financial indicator TRADCNYC which indicates the number of individual stocks participating in the rise or fall of the market; is declining and showing a convergence with the market (S&P500). This signals that the rally is supported by a smaller number of stocks. However, they have a significant weight in the index, for now enough to sustain small rallies.
Positions of financial indicators within the market
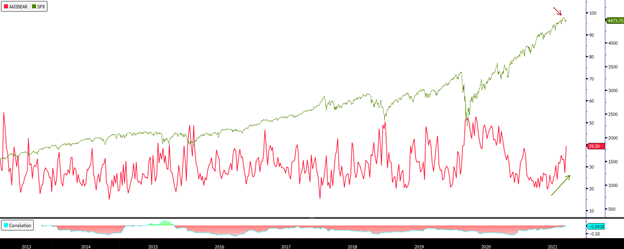
Another interesting financial indicator that has been showing upward signs is the AAIIBEAR index. The AAIIBEAR index indicates individual investor sentiment about the market for the next six months in a negative way. As can be seen below, the index is showing an upward trend from the lows reached in June of this year. The correlation between this index and the market is negative.
Historically, the month we are in has not been the most favorable in terms of return. This data, which goes back to 1950, represents the return and the months in which each month has closed positively, with September being the worst month for the market.