
A climb in the middle of red flags
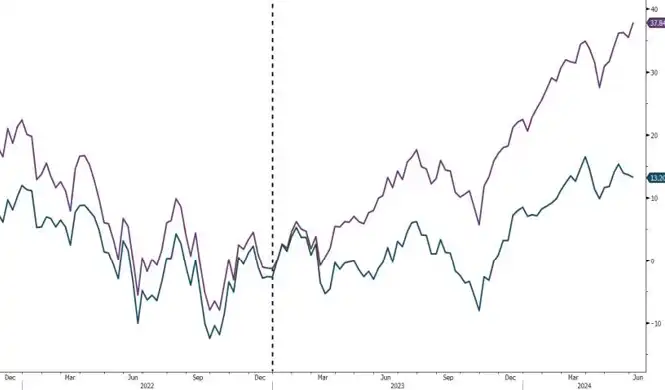
In May, we mentioned the red flags despite the resilience of the market. Investors have forgotten the famous "sell in May and leave" as the S&P 500 rose 5% (chart 1), posting its best May since 2009. NVDA (+25.5%), MSFT (+4.2%) and META (+6.7%) drove the increase.
Chart 1: Performance from 01.2023 to present : S&P 500 Equity weight (+37.8%); S&P 500 Equal weight (+13.2%).
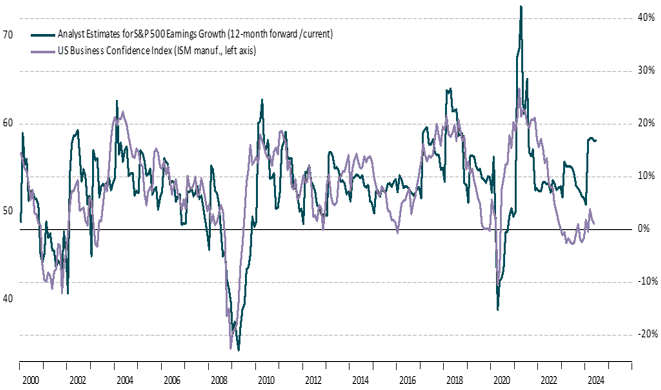
Over the last year, the economy and markets have shown contrasts. Analysts are forecasting 17% profit growth over 12 months, while leading indicators, such as the Purchasing Managers' Survey, do not show strong expectations. The gap between these dynamics highlights a clear divergence between analysts and companies (Figure 2).
Chart 2: Disconnect between analysts and companies: ISM Manufacturing PMI (48.7); Analysts' estimates of 12-month EPS growth (171TP3Q).
Divergences, consumers, liquidity and central banks
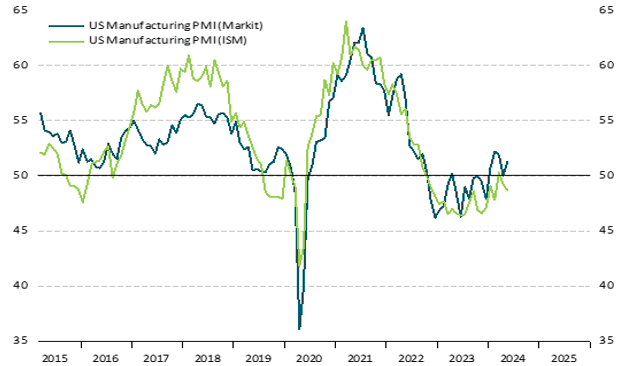
In the US, the Institute of Supply Managers and IHS Markit compile data that usually coincide, but recently their messages differ. The S&P Global manufacturing PMI indicates expansion, while the ISM PMI suggests contraction (chart 3), so we can say that there is a divergence between the two indicators. On the other hand, the rate curve is inverted and managerial confidence in several states points to recession.
Chart 3: ISM Manufacturing PMI (48.7); S&P U.S. Manufacturing PMI (51.3)
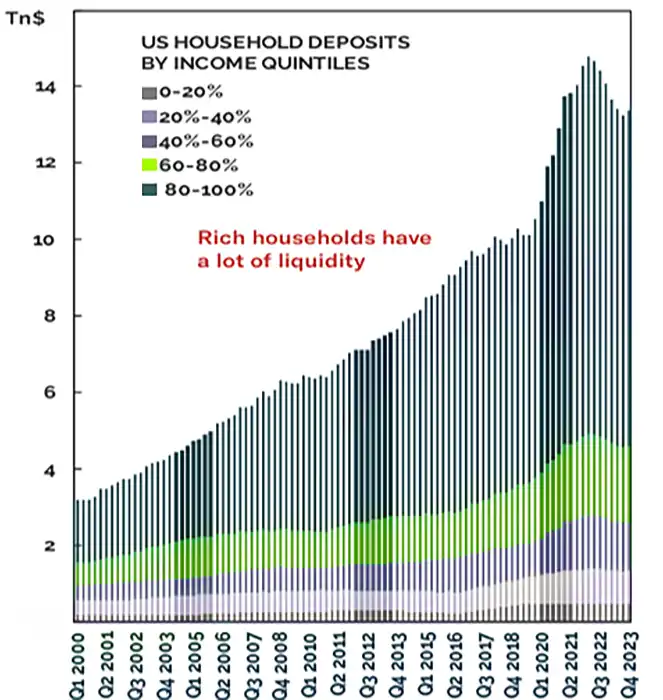
Low- and middle-income households in the U.S. are facing financial pressures, according to the University of Michigan Consumer Sentiment Survey, with purchasing conditions at their worst in a generation. As for the wealthiest Americans, they have been found to be hoarding cash.
Now, one of the key elements that is supporting market growth is high liquidity, which has as its genesis the fiscal and monetary stimuli of the 2020 pandemic. The relocation of cash from households to companies and wealthy families, who then invest it in the financial system, continues to push up financial asset prices (Figure 4).
Figure 4: U.S. Deposits by Income Quintiles
On the other hand, the central banks have begun to cut rates. The European Central Bank cut its refinancing rate to 4.25%, following China, Switzerland and Canada. The Fed is likely to continue, despite solid payrolls numbers. This is because inflationary pressure has eased, but also because economies have run out of steam thanks to higher rates.
From a more technical point of view
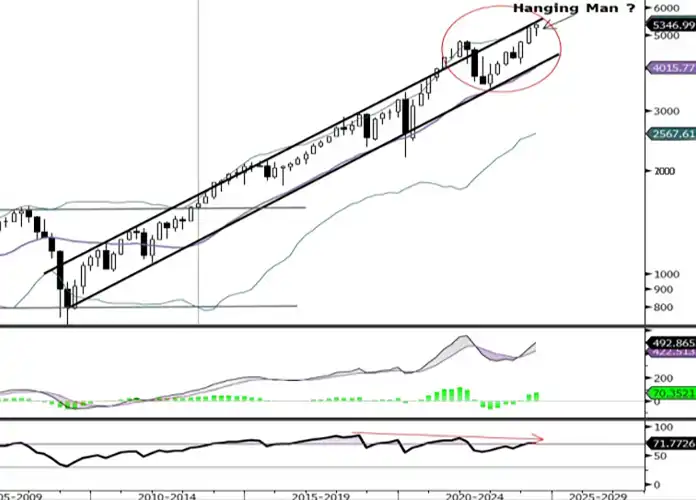
Since October 2022, the market has risen over 50%, approaching the upper limit of the ascending channel since 2009 (Chart 5). Without a similar post-Covid overshoot, further upside is unlikely. Upside potential appears limited unless a similar overshoot occurs.
Chart 5: S&P 500 (5'346.99) / Quarterly Chart
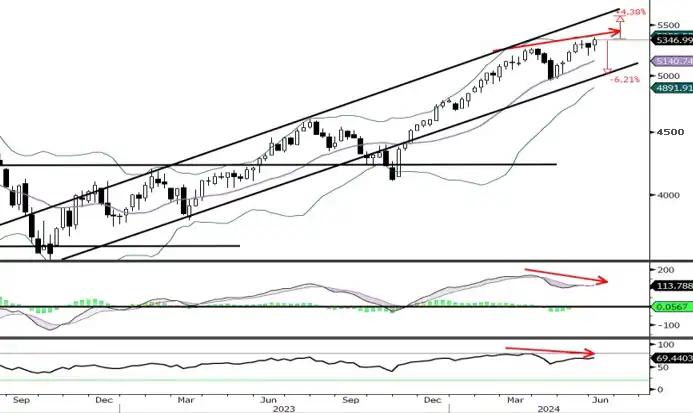
Despite the limited sell signal from the quarterly MACD, the RSI shows a third negative divergence, signaling a possible nearby top (chart 6). On the weekly chart, recent highs lack confirmation from the MACD and RSI indicators, suggesting loss of momentum. In this scenario, a short-term consolidation between 5-6% is likely in the near term.
Chart 6: S&P 500 (5'346.99) / Weekly Chart
What opportunities do we see?
The market, disconnected from economic reality, remains resilient due to liquidity and optimism. However, valuation is high and the economic situation is deteriorating. We believe it is better to wait for a better entry point, as a medium-term correction will offer better investment opportunities and economic clarity.
If you would like to obtain investment advice or identify investment opportunities or diversify your portfolio, our team of brokers will be happy to assist you and provide you with the information and advice you need.
You can contact us through the following form:
Contact with us
"*" indicates required fields
ComShare this content:
DISCLAIMER: Singular Wealth Management, Corp. and Singular Securities, Corp. (SWM&SC), offer perspectives on various markets, sectors and investment opportunities that could be valuable to subscribers of our editorial content. This includes views on different types of securities, as well as commentary on economic and political scenarios. It is crucial to understand that this publication does not constitute financial guidance and is not an invitation to make specific investments. For personalized advice, we recommend using the Unique Advisory Services through our Securities House's qualified financial advisors to achieve your investment objectives. Although the information in this publication comes from reliable sources, we cannot guarantee its accuracy or completeness. Information is current at the time of publication, but may change without notice. Investing in securities involves risks, including the possible loss of principal, and past performance is no guarantee of future returns. SWM&SC personnel may invest in the securities discussed from time to time without receiving any compensation from the companies mentioned. We disclaim any liability for damages resulting from the use of our services. Entity regulated and supervised by the Superintendencia del Mercado de Valores of the Republic of Panama. Singular Wealth Management Corp., "License to operate as a Securities Brokerage Firm, Resolution CNV- No. 219-2005 of September 19, 2005". Singular Securities Corp., "License to operate as a Securities Brokerage Firm. Resolution SMV- No. 672-15 of October 21, 2015"....