

Markets and economic data: where are they going?
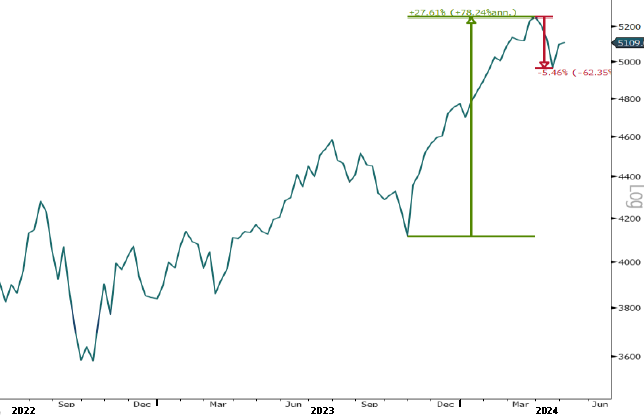
Between November 2023 and March 2024, the market grew +27% (figure 1) after a soft landing and Fed rate cut expectations. It then experienced a controlled consolidation with a -5% decline. Strong economic data countered expectations for rate cuts, reducing expectations from 6 to 2. Jerome Powell ruled out rate hikes, triggering a rally.
Although unemployment in the US and the Eurozone is low, April payrolls disappointed, with 175,000 jobs created instead of the expected 240,000. The labor market is weakening, with the employment subcomponent below the 50-point threshold. Small business hiring plans suggest a possible deterioration in unemployment.
Chart 1: S&P 500 (5'116.13)
Housing: Always a key economic indicator
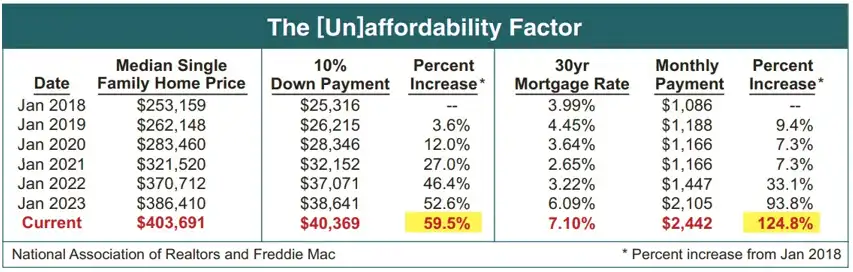
The housing market has faced challenges with a notable increase in the median price of single-family homes. This appreciation, coupled with high mortgage rates, creates an overvalued market, excluding many buyers and trapping existing homeowners in prior mortgages, limiting mobility.
To illustrate this, Investec Research has presented its "Housing Affordability Unaffordability Factor" table. This chart highlights the costs associated with purchasing the median single-family home. Since January 2018, the monthly payments required for such a home have skyrocketed by a staggering 125% (Table 1).
Table 1: Evolution of the median single-family home price since 2018.
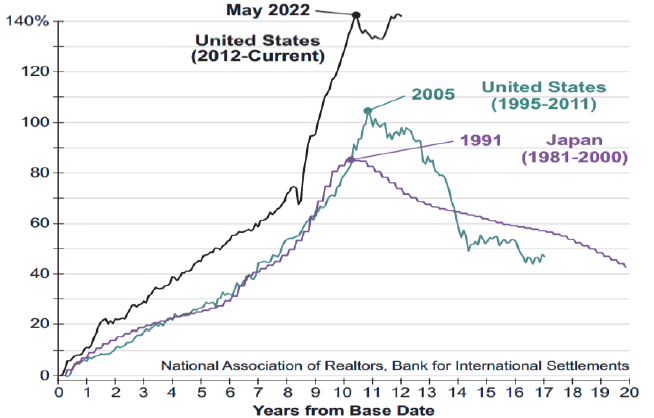
On the other hand, historical precedents in this market may be suggesting a bubble scenario. The most favorable outcome would be a gradual decline in home prices over an extended period, allowing incomes to catch up.
The following chart compares the current 12-year percentage increase in median single-family home prices to those two previous housing bubbles (Japan 90's and the U.S. 05′). The sharp rise in home prices indicates that the current situation could be riskier (Chart 2).
Chart 2: Historical real estate bubbles vs. today
Signs of recession are faint, but persist
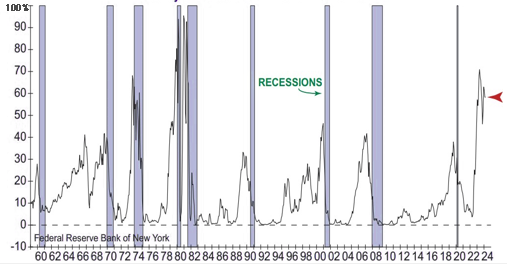
Economic figures have been solid so far, but hard and soft data offer mixed signals. Although growth is solid, the signs of recession persist, especially according to the Fed's yield spread model, which historically predicts recessions.
This is a warning sign that has yet to abate and continues to serve as a strong recession signal is the Fed's yield spread (recession probability) model. This model, which is based on the difference between 10-year and 3-month Treasury yields, has been indicating a recession since the spread reversed in late 2022.
Figure 3: Fed Yield Spread Model (probability of recession in the next 12 months)
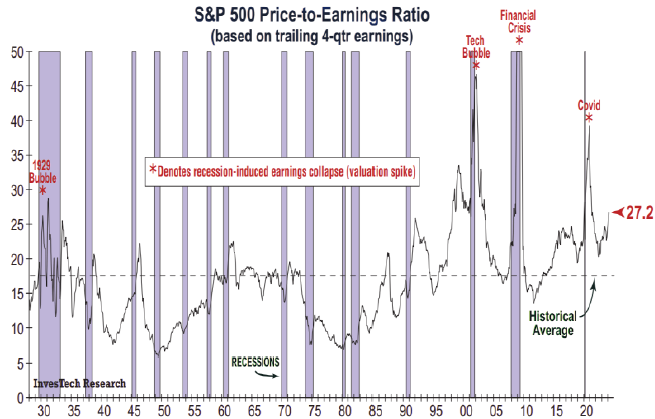
Elevated valuations in the equity market also deserve attention. Although current extremes do not always trigger bear markets, they are crucial in assessing potential losses.
The price-to-earnings (P/E) ratio of the S&P 500, although adjusted, still reflects levels comparable to bubble times (Figure 4). In addition, the price-to-sales (P/S) ratio of the S&P 500, which is less subject to manipulation, is at one of its highest levels since 1990.
Chart 4: Current P/E ratio of the S&P 500 (27.2x)
What opportunities do we see?
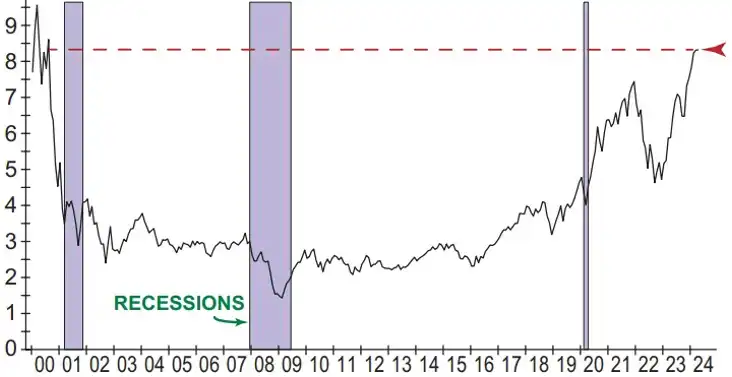
The market has been resilient since October 2023, with no visible signs of a collapse or bear market. However, dynamic changes, such as inflationary pressures and rising interest rates, impact the real estate market. The technology sector of the S&P 500 is historically expensive, concentrated (chart 6) and could signal future declines. Investor caution should be key in this environment.
Graph 6: Price/sales ratio of the technology sector (8.4x)
If you would like to obtain investment advice or identify opportunities in commodities, our team of brokers will be happy to assist you and provide you with the information and advice you need.
You can contact us through the following form:
Contact with us
"*" indicates required fields
ComShare this content:
DISCLAIMER: Singular Wealth Management, Corp. and Singular Securities, Corp. (SWM&SC), offer perspectives on various markets, sectors and investment opportunities that could be valuable to subscribers of our editorial content. This includes views on different types of securities, as well as commentary on economic and political scenarios. It is crucial to understand that this publication does not constitute financial guidance and is not an invitation to make specific investments. For personalized advice, we recommend using the Unique Advisory Services through our Securities House's qualified financial advisors to achieve your investment objectives. Although the information in this publication comes from reliable sources, we cannot guarantee its accuracy or completeness. Information is current at the time of publication, but may change without notice. Investing in securities involves risks, including the possible loss of principal, and past performance is no guarantee of future returns. SWM&SC personnel may invest in the securities discussed from time to time without receiving any compensation from the companies mentioned. We disclaim any liability for damages resulting from the use of our services. Entity regulated and supervised by the Superintendencia del Mercado de Valores of the Republic of Panama. Singular Wealth Management Corp., "License to operate as a Securities Brokerage Firm, Resolution CNV- No. 219-2005 of September 19, 2005". Singular Securities Corp., "License to operate as a Securities Brokerage Firm. Resolution SMV- No. 672-15 of October 21, 2015"....